In this level you will learn:
How to Explain Energy Trends
Normal vs Abnormal Energy Waste
How to Find Energy Waste
Looking for Electricity Waste
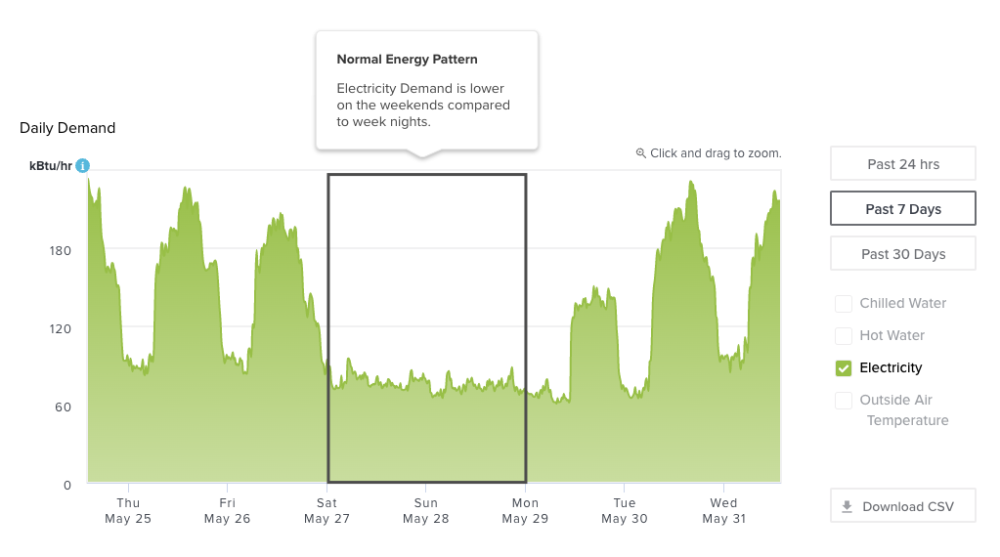
01. An Energy Efficient Building
- In an energy-efficient building, electricity use at night and on weekends should drop.
The graph below shows the electricity demand dropping during the weekend,
as well as dipping on a daily basis during the night.
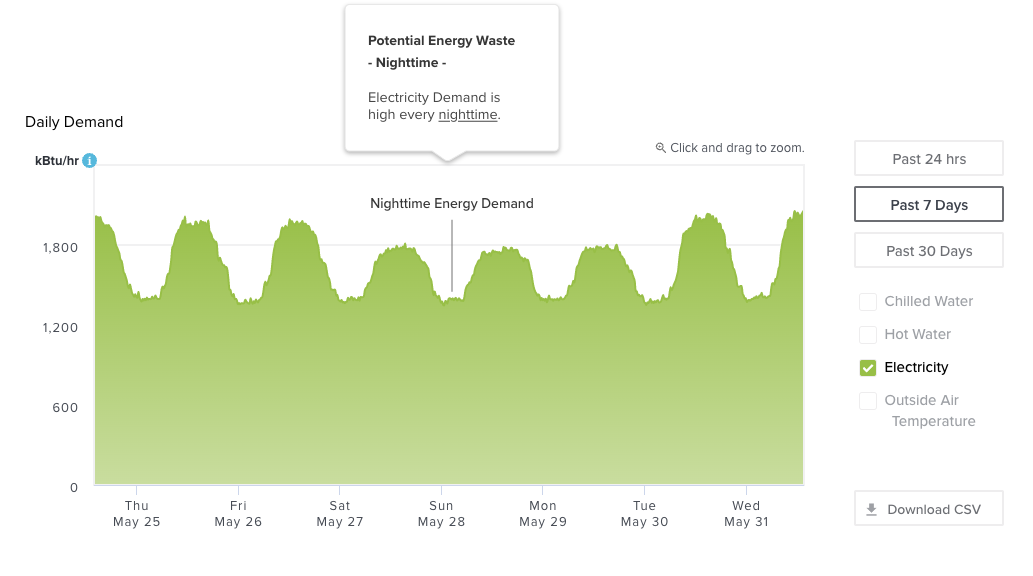
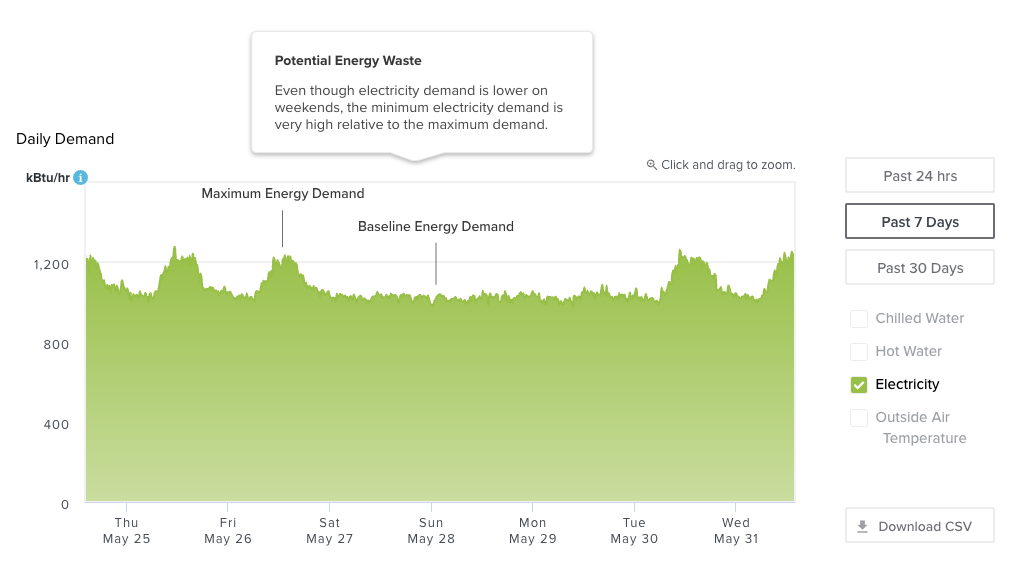
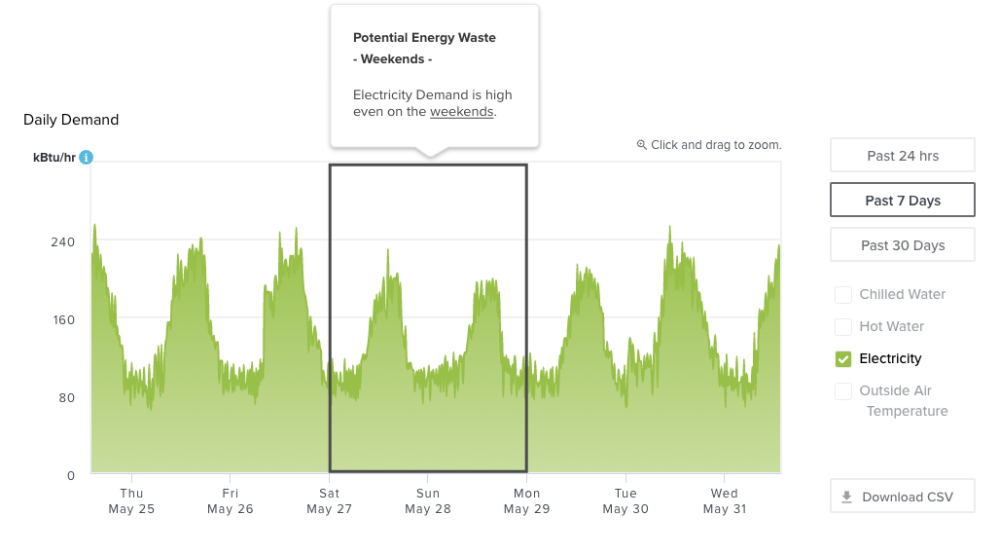
02. Potential Energy Waste
- When electricity demand remains high over the weekend and/or weeknights, we consider this Abnormal and a Potential energy waste.
The graphs below indicate potential energy waste worthy of investigation.
It's Almost Time to Explore
Energy Use in Your Building!
You'll find your building on the Campus Energy Education Dashboard (CEED) using the map or the building search, and check out the electricity demand data.
Not sure how to use the demand graphs on the energy dashboard? Watch Dan explain what to look for in his video on building demand trends.